The stock market is a central location where investors come together to buy and sell shares of public companies. The best known stock exchanges are the New York Stock Exchange and the American Stock Exchange while locally there is the Trinidad & Tobago Stock Exchange.
In order for any investor to buy or sell a share, the services of a broker must be sought. It is very rare that investors can purchase shares directly from the stock market. The buying and selling of shares are normally achieved through the use of stock brokerage firms who are entities that conduct stock transactions on behalf of investors. This service is conducted for a fee or commission.In Trinidad & Tobago, there are at least eight (8) companies which both individuals and firms can use to buy or sell stocks.
Once the share is purchased, the price will move either above or below the price you paid for it and you will either experience gains or losses. Share prices are largely determined by the forces of supply and demand. Generally, if there is an increased demand for a particular share, its share price will rise as there would be more buyers than sellers. In contrast, if a lot of persons want to sell their shares, the share price will fall as there would be more sellers than buyers.
Figure 1: Demand and Supply
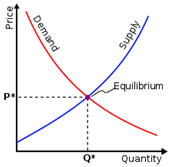
Figure 1 illustrates a typical demand and supply curve. The point where these two curves intersect is termed the equilibrium point – it is at this point where the price of the particular item is established.
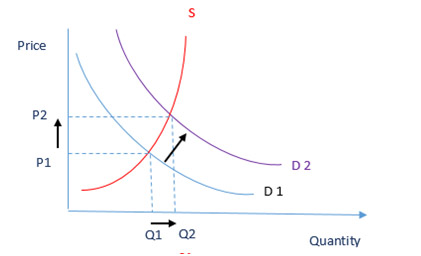
When the demand increases for an item without an equal increase in supply– in this case the shares of a particular company, the demand curves shifts outwards to D2 as illustrated in Figure 2. The new demand curve intersects the supply curve at a new equilibrium point– P2 (a higher price when compared to P1).
Figure 2: Increased Demand and the impact on price
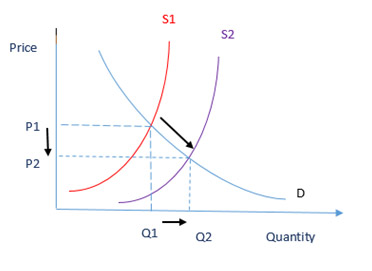
In contrast, in the case when there is an increased supply of shares on the market but demand remains the same, this excess amount causes the supply curve to shift outwards to S2 and creates a downward pressure on price as illustrated in Figure 3. The new supply curve intersects the demand curve at a new equilibrium point – P2 (a lower price when compared to P1).
Figure 3: Increased Supply and the impact on price
The factors that influence the demand and supply for shares are numerous, but the primary influence is the long-term earnings potential of companies. If a company demonstrates long-term earnings potential and has a positive future outlook, investors will be attracted to its share and many persons would want to purchase the share of that particular company. This increased or heightened demand will cause the price of the stock to rise. On the other hand, if the company has bleak earnings prospects and a poor outlook, investors would be reluctant to purchase their stock and actually be driven to sell their shareholdings. This excess supply of stock will drive prices lower.
When the stock market experiences a period of continued and sustained share price increases, it is known as a “bull” market. In contrast, when share prices are falling steadily and in a downward trend, the stock market is known as a “bear” market.
There are other factors that affect share prices, such as earnings, economic news and political events. Once listed on a public stock exchange, the companies must report and publish its financial performance periodically. The company’s financial results are normally anticipated by investors as it details how profitable the company was over a particular period of time. It is generally believed that a company’s price will follow its earnings – thus if the company continues to be profitable and make more money, the stock price should increase. Similarly, if the company is losing money and its earnings are declining, the stock price will usually fall.
The performance of the economy and industry that the company operates in also plays a major role in determining the share price of the company. Thus when economic activity is picking up and the growth prospects of the industry is positive, the shares of the particular companies usually post higher and higher returns as investors believe that the companies that operate within that particular industry or economy will benefit from the improved growth prospects. Similarly, when the economy is losing momentum and the industry’s growth prospects are dampened, the prices of the companies’ stock that operate within the economy and the industry may fall.
Political turmoil and uncertainty normally causes stock prices to fall. Investors are not as confident about the future of the economy and industries as such political upheavals can lead to a change of policies that may negatively impact company’s operations and cost structure.
How to read a Stock Table
After the end of every day, the stock exchange normally provides a summary of the day’s events for all shares that are listed on the stock market. This information is usually laid out in a summary stock table as presented in Figure 4. Below details the explanations of the information that is normally presented. If after reading you still don’t understand the meaning of the various terms and workings of the stock market, you can always contact a Financial Advisor who is always willing to help you and bring you closer to the realization of your financial goals.
Figure 4: Snapshot of a Stock Table
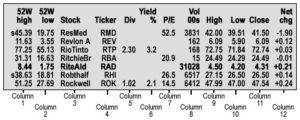
- Column 1 and 2: 52-week high and low refers to the highest price and lowest price that the particular stock has reached over the past year or 52 week period.
- Column 3: This column tells you the company name which is usually abbreviated.
- Column 4: The Company’s stock also has a stock symbol assigned to it, referred to as the Ticker.
- Column 5: This refers to the amount of earnings paid out to shareholders in dividends and is normally quoted as an annual amount and on a per share basis. Eg. RioTinto paid a dividend of $2.30……..
- Column 6: Yieldrefers to what percentage that particular dividend is to the stock price. Yield, which is most important to income investors, is calculated by dividing the annual dividend by the current stock price.
- Column 7: This column indicates the ratio between the price of the stock and the company’s earnings. This ratio (also called the earnings multiple or just multiple) is frequently compared to the PE ratios of the company’s peers and to the industry average to determine whether a stock is a good value.
- Column 8: Volumetells you how many shares of that particular stock were traded that day.
- Column 9& 10: shows the highestand lowest price respectively paid for the stock during the day.
- Column 11: shows the price the stock closed the day at.
- Column 12: Net change shows the difference between the last traded price to the previous day andanswers the question “How did the stock price end today compared with its trading price at the end of the prior trading day?”
While everyone may not want to give up their day job to know every detail and functioning of the stock market, as an investor you need to understand what the stock market is and how you can participate without suffering too many losses.
MF 4TH June 2014
You should consult with a Financial Advisor at the UTC, who can assist you in planning major life decisions and events.