Monitor Performance
& Make Your Next Move
Let’s talk about your returns and gains!
The Net Asset Value for the respective Funds as at April 15, 2024
| Name of Fund | Offer Price | Bid Price |
|---|---|---|
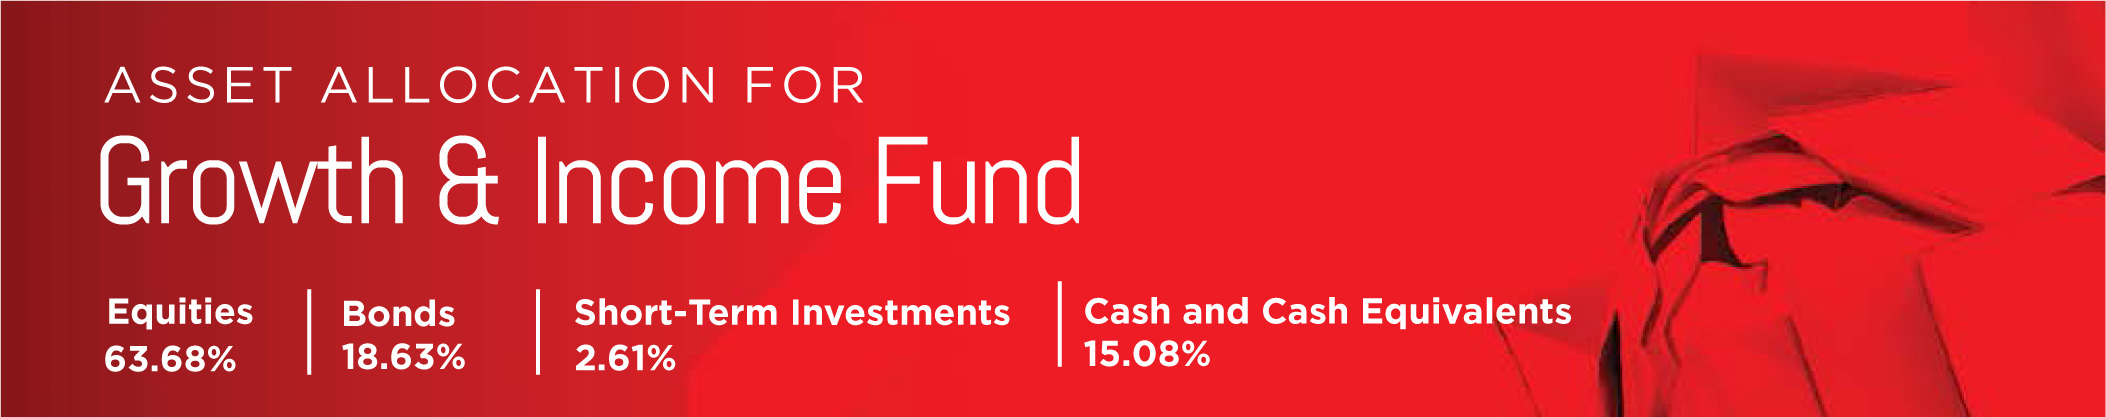
| Growth & Income Fund | TT$18.82 | TT$18.45 |
| Universal Retirement Fund | TT$50.42 | TT$50.42 |
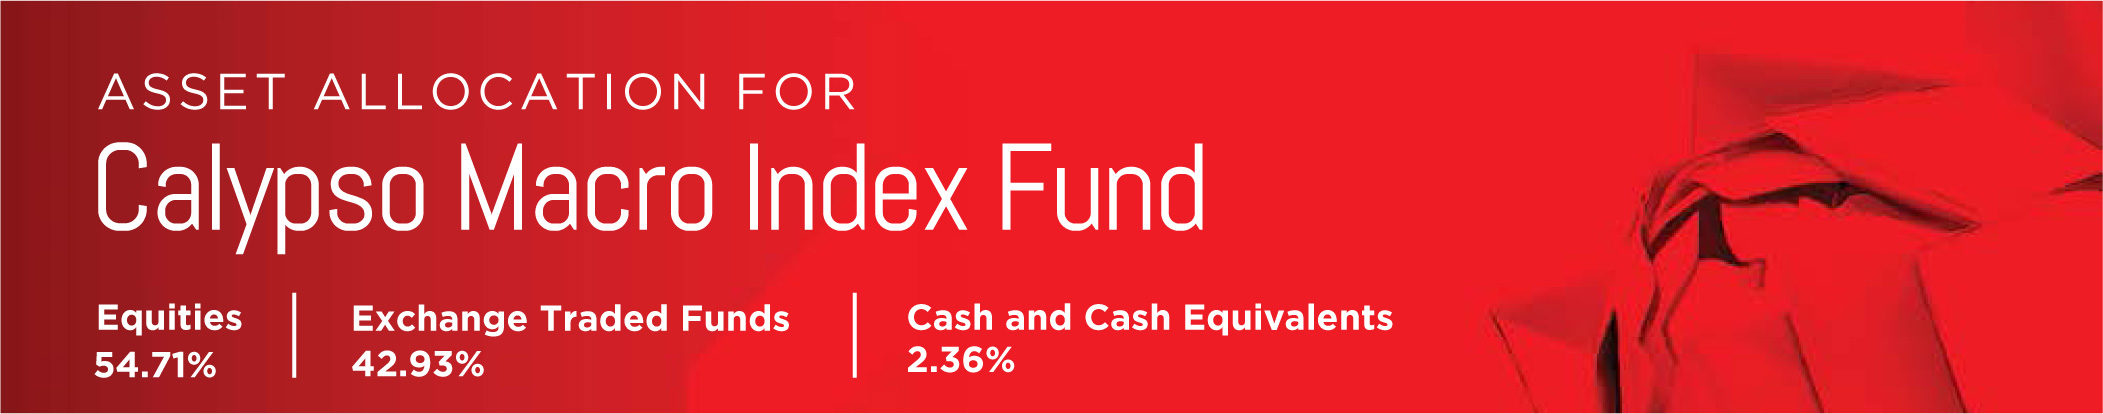
| Calypso Macro Index Fund (NAV) | TT$30.86 | TT$30.86 |
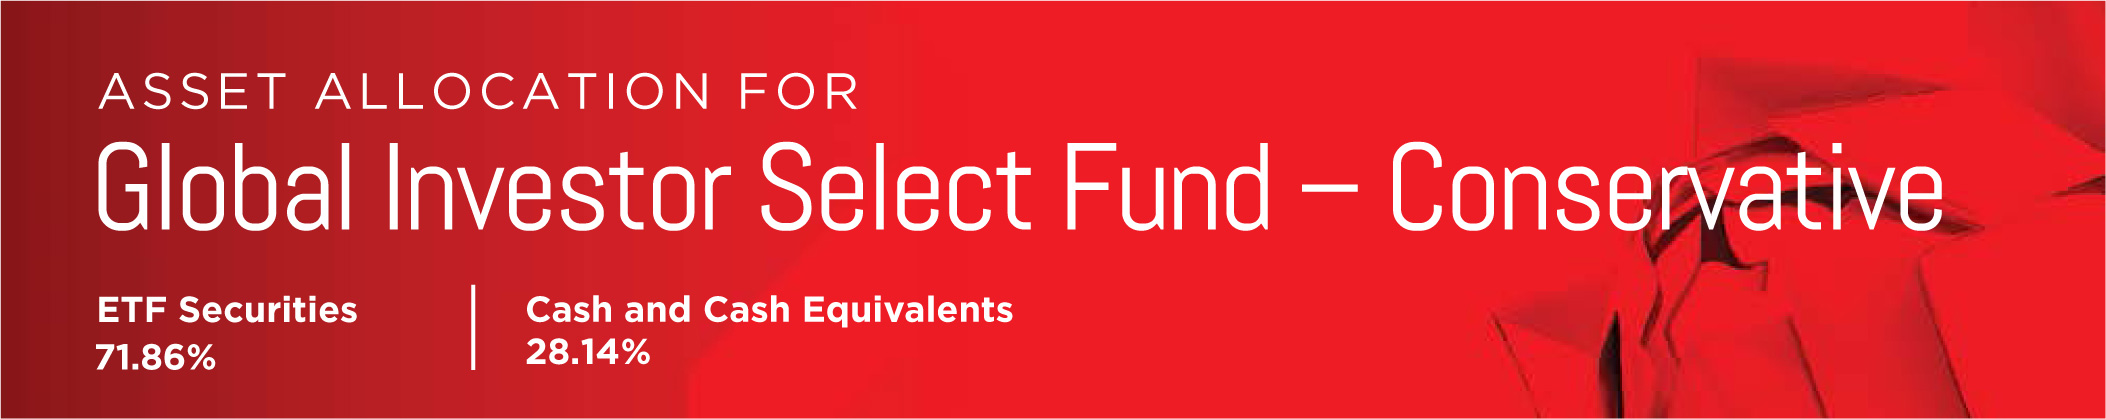
| Global Investor Select (Conservative) | US$19.51 | US$19.51 |
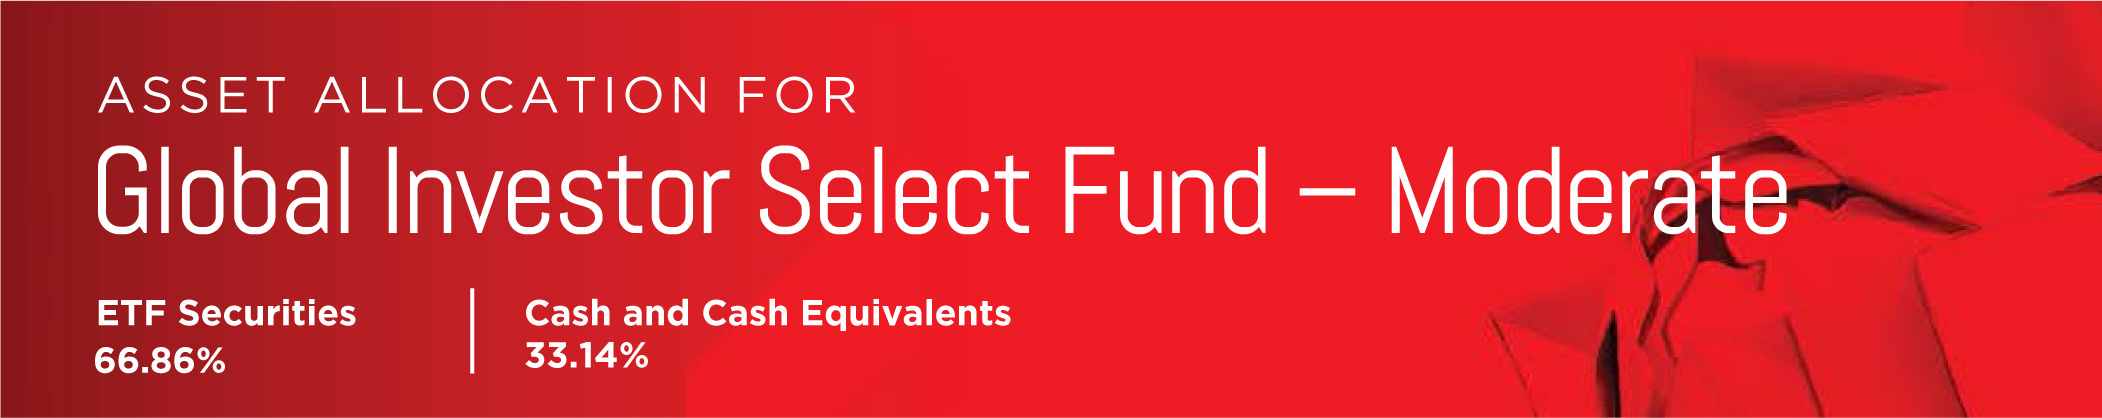
| Global Investor Select (Moderate) | US$20.71 | US$20.71 |
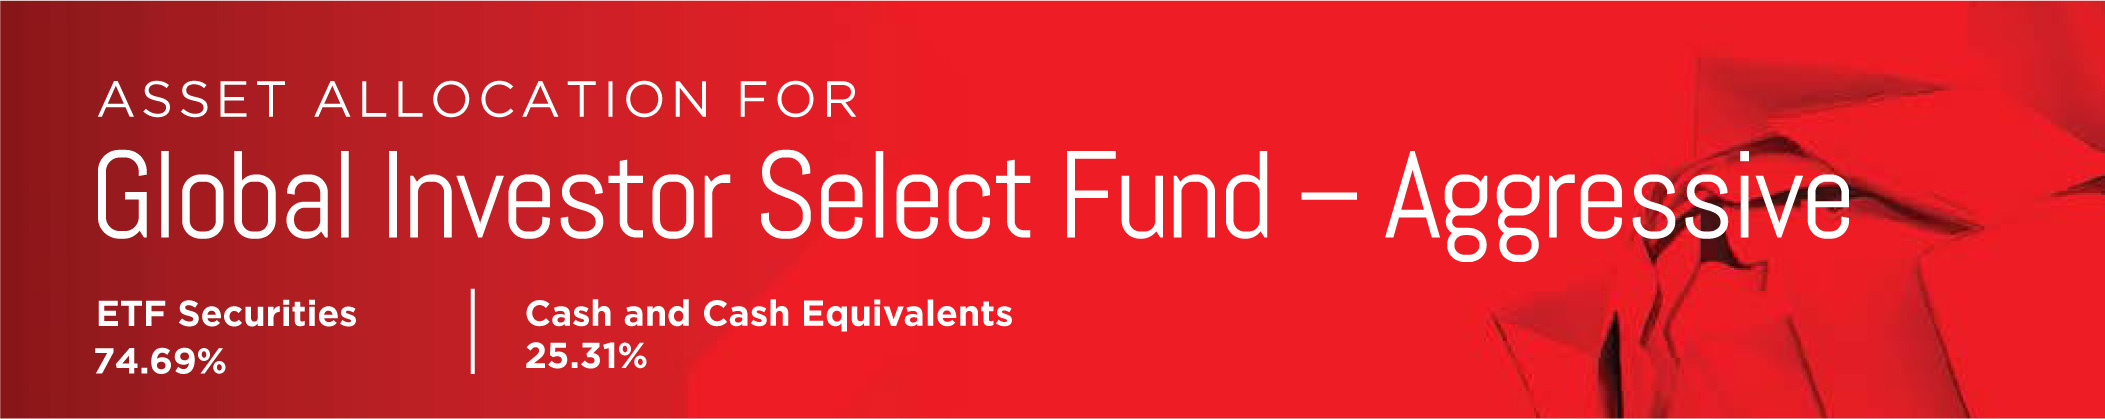
| Global Investor Select (Aggressive) | US$20.42 | US$20.42 |
Whenever you make investments, you typically place the money in any of a range of different assets and earn returns for different periods of time. For instance, you might invest in shares of stock and exit after five years, or you might buy a treasury bill with a maturity date three months after purchase. To compare the returns of these different investments, you need to annualise them. This is straightforward if you are already getting annual returns on your investments.
By converting all your returns to an annualised rate, you can cut through the ups and downs by smoothing out all those gains and losses. This will help you better understand the returns you are getting as an average figure across your investment portfolio. It also enables you to stay on top of how your portfolio is performing, so you can make buy/sell decisions and move money away from underperforming investments.
The performance data quoted represents past performance, which does not guarantee future results. Current performance may differ from figures shown. Investment return and principal value will fluctuate with market conditions, and you may have a gain or a loss when you sell your shares.